Diskuze: Python - zpracování dat
Zobrazeno 5 zpráv z 5.


Buď sem napiš konkrétní otázku a nebo dej cenovou nabídku 

google = zpracování dat pomocí programu v pythonu - grafy - priklad
Hm, kupodivu google zklamalo. Tak postupne...
google = python example read file
file = open(“testfile.text”, “r”)
print file.read()
google = python example write file
file = open(“testfile.txt”,”w”)
file.write(“Hello World”)
file.write(“This is our new text file”)
file.write(“and this is another line.”)
file.write(“Why? Because we can.”)
file.close()
google = python example read file parse csv
--- soubor.csv ---
name,department,birthday month
John Smith,Accounting,November
Erica Meyers,IT,March
---
# oddelovac carka, zalamovani radku \n
# ostatne, na te strance je spoustu ruznych prikladu https://realpython.com/python-csv/

import csv

with open('employee_birthday.txt') as csv_file:
    csv_reader = csv.reader(csv_file, delimiter=',')
    line_count = 0
    for row in csv_reader:
        if line_count == 0:
            print(f'Column names are {", ".join(row)}')
            line_count += 1
        else:
            print(f'\t{row[0]} works in the {row[1]} department, and was born in {row[2]}.')
            line_count += 1
    print(f'Processed {line_count} lines.')
google = python generate graph
# https://plot.ly/python/
# https://medium.com/python-pandemonium/data-visualization-in-python-line-graph-in-matplotlib-9dfd0016d180
# https://pythonprogramming.net/matplotlib-python-3-basics-tutorial/

from matplotlib import pyplot as plt

x = [5,8,10]
y = [12,16,6]

plt.plot(x,y)

plt.title('Epic Info')
plt.ylabel('Y axis')
plt.xlabel('X axis')

plt.show()
Takovy google ve spravnych rukou muze byt celkem uzitecny pomocnik...
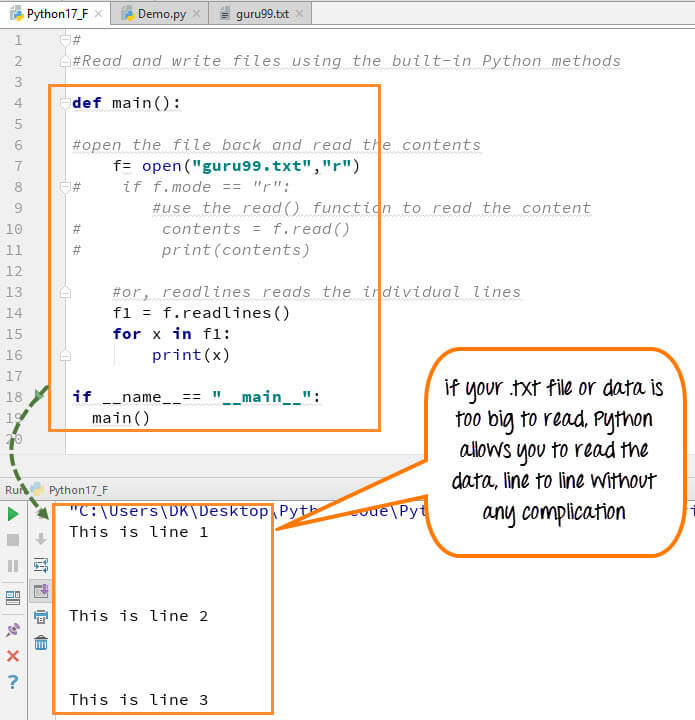
google = python example read file
https://www.guru99.com/…thon17.6.jpg
def main():
    f= open("guru99.txt","w+")
    #f=open("guru99.txt","a+")
    for i in range(10):
         f.write("This is line %d\r\n" % (i+1))
    f.close()
    #Open the file back and read the contents
    #f=open("guru99.txt", "r")
    #if f.mode == 'r':
    #   contents =f.read()
    #    print (contents)
    #or, readlines reads the individual line into a list
    #fl =f.readlines()
    #for x in fl:
    #print(x)
if __name__== "__main__":
  main()
V prvni casti vytvori soubor, zapise radky. Ve druhe je pak cte radek po radku do prom. X. A tobe se mozna bude hodit jeste dalsi parsovani. Na to by mel stacit split, tusim.
Já jen poradím, že pokud by jsi náhodou měla aplikaci v PyQt, tak můžu
všema deseti doporučit knihovny PyQt Graph, které mají supr jednoduché
přístupy na vložení do existujících Qt oken, apod 


Zobrazeno 5 zpráv z 5.